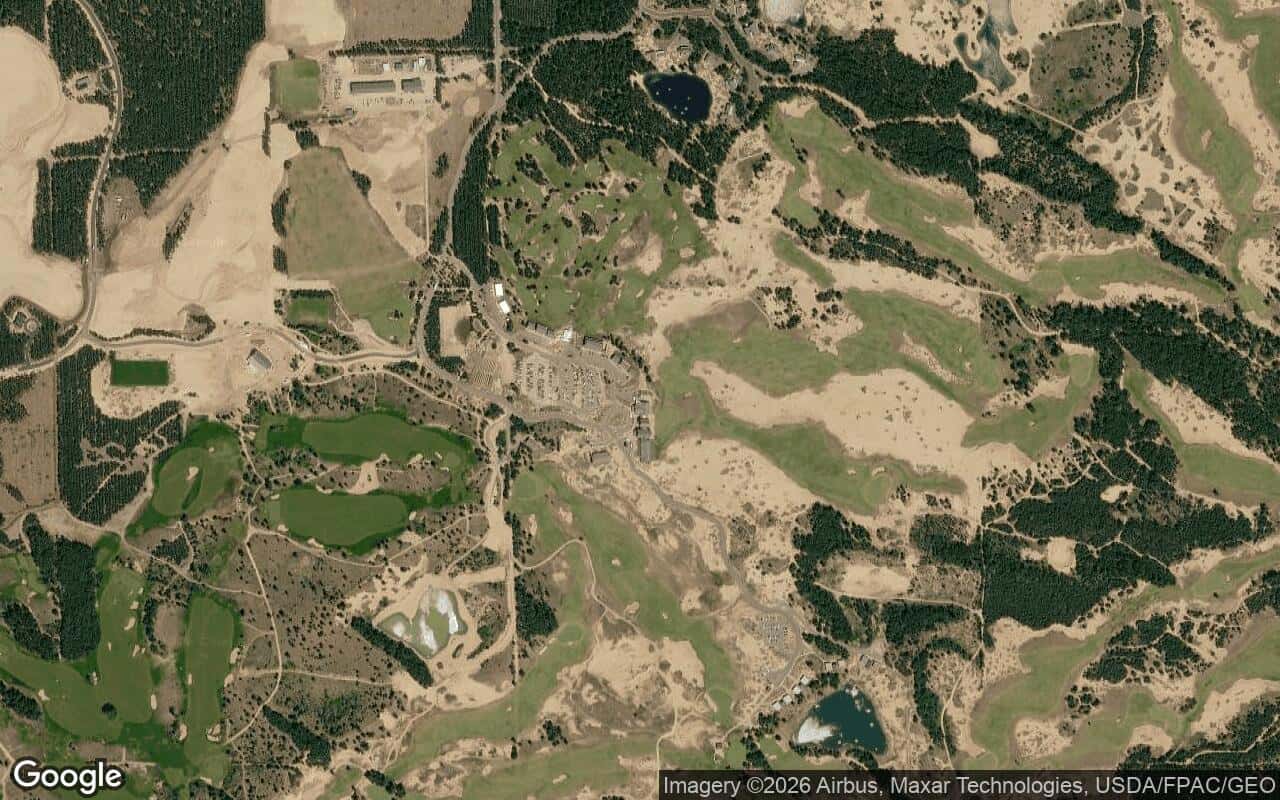

LIVE NOW: The 2026 U.S. Mid-Amateur is underway at Sand Valley. Follow the 2026 U.S. Mid-Amateur live leaderboard and updates →
Getting into the U.S. Mid-Amateur is its own achievement. A record 6,124 players entered the 2026 championship. Two hundred sixty-four of them tee it up at Sand Valley on September 26.
Then, two days later, 200 of them go home.
That's the part nobody prepares for. The qualifier is a one-day shootout you either survive or you don't. The championship proper is something different: 36 holes of stroke play across two golf courses, and a bracket that only has 64 spots in it. Most of the field never hits a shot in the competition they actually came for.
So what does it take? Not vaguely — precisely. We pulled the archived stroke-play leaderboards from seven U.S. Mid-Amateurs (2018, 2019 and 2021 through 2025; the 2020 championship was not played) and ran the numbers. What came out is more orderly than you'd expect from a championship contested on wildly different golf courses in wildly different parts of the country.
In this piece
Jump to the number, the medalist rule, the bubble, the Sand Valley projection or the game plan.
The answer, in one number
+3.3
strokes over par — the average 36-hole cut line for the top 64, across seven championships.
1.6
strokes over par per round, on average
+1 to +5
the full seven-year range of the cut
15.3
players tied on the cut number, every year
The headline number: par plus three
Here is every stroke-play qualifying cut since 2018.
Cut line to make match play
Strokes over par for 36 holes, by championship
| Year | Venues | Par | Medalist | Cut for the top 64 |
|---|---|---|---|---|
| 2018 | Charlotte CC / Carolina GC (N.C.) | 142 | −5 (137) | +5 (147) |
| 2019 | Colorado GC / CommonGround (Colo.) | 142 | −6 (136) | +5 (147) |
| 2021 | Sankaty Head / Miacomet (Nantucket, Mass.) | 140 | −9 (131) | +2 (142) |
| 2022 | Erin Hills / Blue Mound (Wis.) | 141 | −7 (134) | +3 (144) |
| 2023 | Sleepy Hollow / Fenway (N.Y.) | 141 | −6 (135) | +3 (144) |
| 2024 | Kinloch / Independence (Va.) | 141 | −8 (133) | +1 (142) |
| 2025 | Troon CC / Troon North (Ariz.) | 142 | −5 (137) | +4 (146) |
Mean cut: +3.29. Median: +3. Standard deviation: 1.39 strokes. Full range across seven years: +1 to +5.
Translated into the only currency that matters when you're standing on the first tee: the average U.S. Mid-Amateur cut line is 1.6 strokes over par per round. Two rounds of 73 on a par 71 gets you in more often than it doesn't. Two rounds of 75 has never once been enough.
That's the whole article in one paragraph. But the interesting findings are in why that number is so stable.
Finding 1: The cut tracks the medalist, not the golf course
This is the most striking thing in the data set, and it isn't close.
Medalist to 64th place
The distance between the best score in the field and the last man into the bracket
Seven championships. Seven different venues, from a Nantucket links to a Colorado mountain setup to the Sonoran desert. The gap between the medalist and the 64th man has been 9, 9, 9, 10, 10, 11 or 11 shots. Every single time. Mean 9.86, standard deviation 0.83.
The cut line as a raw number swings four strokes year to year. The cut line relative to the best score in the field barely moves at all.
The takeaway
The most useful thing you can do at lunch on Saturday isn't compute your own position. It's look at the top of the board and subtract ten. That estimate has been accurate within a stroke in all seven years we studied.
Finding 2: Level par has never missed
Because the distribution is so tight, you can convert any 36-hole score into a straight historical survival rate.
Survival rate by 36-hole score
How often this score made match play, 2018–2025 (seven championships)
Level par for 36 holes has made match play in every edition we examined, and in the toughest year it did so comfortably. The worst even par has ever placed is roughly 50th.
+6 has never qualified. Not once, not at altitude in Colorado, not in a Wisconsin wind. If you are six over with holes to play in Round 2, you are not on the bubble. You are out, and the only question is whether you know it yet.
The awkward zone is +3 and +4, which is exactly where the largest number of players end up.
Finding 3: The bubble is a traffic jam, not a line
Here's the finding that should change how you play the 36th hole.
In all seven championships, the cut number was the single most populated score in the field. Not near it. Exactly on it. An average of 15.3 players finished on the number — 16 in 2018, 18 in 2019, 13 in 2021, 17 in 2022, 16 in 2023, 12 in 2024.
Where the field piles up
Players at each score around the cut — 2022, Erin Hills / Blue Mound
And the score one stroke worse than the cut was almost as crowded: 10, 13, 17, 19 and 14 players in the five years we have full field counts for.
| Year | One better than cut | On the cut | One worse than cut |
|---|---|---|---|
| 2018 | 11 | 16 | 10 |
| 2019 | 12 | 18 | 13 |
| 2021 | 18 | 13 | 17 |
| 2022 | 17 | 17 | 19 |
| 2023 | 9 | 16 | 14 |
The takeaway
A single stroke in this championship is worth 10 to 19 positions. A three-putt from 25 feet on the last green is not a shot. It's a dozen players moving past you and a Monday flight home. The corollary is just as true in reverse: two birdies in the last hour moves you past twenty people.
It also explains the gentler truth about seeding. The gap between finishing 64th and finishing 32nd averages just 2.57 strokes. Between 64th and medalist: 9.86. Nearly the entire bracket lives inside a ten-shot band.
Here's the full ladder, averaged across seven years:
The leaderboard ladder
Average score to finish in each position, 2018–2025
Finding 4: Plan on a playoff
Because the field piles up on the number, the stroke-play qualifier almost never ends cleanly. The archived playoff sheets confirm a playoff for the final match-play spots in 2018, 2019, 2021, 2022 and 2023 — five for five in the years where the playoff scorecards survive in the record — and the USGA scheduled a Monday-morning playoff again in 2025 at Troon.
The severity varies enormously:
| Year | In the playoff | Spots available | Eliminated |
|---|---|---|---|
| 2018 | 16 | 12 | 4 |
| 2019 | 18 | 6 | 12 |
| 2021 | 13 | 7 | 6 |
| 2022 | 17 | 12 | 5 |
| 2023 | 16 | 14 | 2 |
The 2019 playoff at Colorado Golf Club ran nine holes — 10 through 18 — to get from 18 players down to six. Eighteen men who had played 36 holes of championship golf, tied to the stroke, and two-thirds of them went home.
The takeaway
Finish Sunday on or near the number and you are playing Monday morning — early, before the first matches, possibly for nine holes. Eat, hydrate, keep the caddie, don't celebrate, don't grieve. More Mid-Am careers have ended in a cold 7:10 a.m. playoff than in the Round of 64.
Finding 5: Saturday can't win it, but it can't quite lose it either
The conventional wisdom is that you have to get off to a start. The data says something more nuanced. At Troon in 2025, among the 64 players who made match play:
42%
broke par in Round 1
39%
were over par after 18 and still made it
20%
opened 74 or worse
78
worst opening round that still made the bracket
Kale Waaso opened 78 and came back with 67. Chris Kamin and Mitchell Fedorka both opened 77 and shot 67. Meanwhile Chandler Mulkey opened 66 — one off the lead — shot 79 on Sunday, and finished T45, hanging on by a stroke.
Here's what Round 2 actually demanded of each group in 2025:
| Round 1 score | Qualifiers | Avg Round 2 | Worst R2 that still got in |
|---|---|---|---|
| 66–69 (under par) | 16 | 73.5 | 79 |
| 70–71 (around par) | 23 | 71.9 | 75 |
| 72–73 (+1 to +2) | 12 | 71.2 | 74 |
| 74 or worse | 13 | 69.1 | 71 |
That bottom row is the honest answer to "am I still alive after a bad first round?" Yes — if you are prepared to go shoot something in the 60s. Every single player who opened 74 or worse and made the bracket in 2025 shot 71 or better on Sunday. There were no soft recoveries.
And it's venue-dependent. At Kinloch in 2024, where the scoring was far lower and the cut fell at +1, not one qualifier opened worse than 74. The recovery window that existed in the Arizona desert simply wasn't there in Virginia. The tighter the cut, the smaller the margin for a bad Saturday — which is another way of saying: the harder the golf course plays, the more a disaster round can be survived.
Projecting Sand Valley: what the number should be
The 45th U.S. Mid-Amateur is played over The Lido (7,219 yards, par 71) and the Sand Valley course (7,122 yards, par 71) — a combined par of 142 over 14,341 yards, the longest two-course setup in the modern history of the championship. The field splits between both courses and rotates for Round 2; match play is contested entirely on The Lido.
2026 cut-line projection
Seven-year base rate applied to a combined par of 142
Three factors push that estimate around.
Length argues higher. At 14,341 yards over two days, this is a longer test than Troon (13,936) produced last year at the same par, and Troon cut at +4. Raw yardage isn't destiny in a Mid-Am field — these are not short hitters — but it makes the par 5s less automatic and the long par 4s genuinely long.
Wind is the whole ballgame. The Sand Valley property is open, sandy barrens with almost no tree protection, and The Lido is a Long Island links transplanted onto it. That's a golf course designed to be played on the ground into a breeze. A calm two days and this field will eat it; the medalist could go 8 or 9 under and, per Finding 1, drag the cut down toward even par. A sustained 15 mph and the number could push to +6 — a figure no U.S. Mid-Amateur cut has ever reached.
The field is the strongest it has ever been. A record 6,124 entries fed these 264 spots, and the top of the field — Hagestad chasing a fourth title, Holtz defending, Beck from 2024 — is as deep as the championship has seen. Field strength compresses the top of the leaderboard, which by the medalist-gap relationship pulls the cut down, not up.
Our read
Plan for 145 or 146. A windy Saturday makes 147 live; a calm one makes 143 the number.
If you want a single target to carry into the week: two rounds of 73 gets you into the bracket in most conditions, and never leaves you worse than the playoff.
What this means for your game plan
The numbers point at a handful of things that are genuinely actionable.
1. Play to +3, not to the lead. The medalist is irrelevant to your week unless you are the medalist — and medalists rarely go on to win the thing anyway. Getting into the bracket is the entire objective of Saturday and Sunday, and a 64 seed and a 1 seed play the same number of matches.
2. The big number is the killer, not the missed birdie. With 15 players sitting on the cut score, one double bogey is roughly a dozen positions. Bogey is survivable at a rate of about six per 36 holes. Doubles are not. On an exposed, sandy, wind-blown property, that means taking your medicine out of the waste areas rather than trying to be a hero from a bad lie.
3. Know the number at the turn on Sunday. Take the leader's score, subtract ten, and you have a live cut estimate that has been accurate within a stroke in all seven years we studied. That's far better information than a scoreboard position, which moves twenty places while you're walking to the next tee.
4. Assume Monday morning. Finish on or near the number and you're almost certainly playing a playoff before the Round of 64. Prepare for it like a round, not like a formality.
5. A bad Saturday isn't over — but the price is a round in the 60s. That's the historical rate, not a pep talk. Every 2025 qualifier who opened 74 or worse backed it up with 71 or better.
Methodology
Cut lines, medalist scores, positional ladders and score distributions were compiled from archived USGA stroke-play qualifying leaderboards for the 2018, 2019, 2021, 2022, 2023, 2024 and 2025 U.S. Mid-Amateur championships (the 2020 championship was not contested). Combined par is the sum of the two host-course pars. Round-by-round recovery analysis for 2024 and 2025 uses the 64 qualifiers only; players who missed the cut are not included in those averages, which means the recovery figures describe what successful comebacks looked like rather than how often comebacks were attempted. Bubble-density counts for 2021–2023 were read from the archived leaderboards and may vary by a player or two at page boundaries. Playoff participation is drawn from the archived playoff scorecards, which survive for 2018, 2019, 2021, 2022 and 2023. The 2026 projection applies the seven-year distribution of cut-to-par to Sand Valley's combined par of 142; it is a base-rate estimate, not a forecast of conditions.